What are Summary Dashboards?
Summary Dashboards are graphs and visualizations of learner activity based on xAPI statements that have been brought over from the Veracity Learning Record Store (LRS) to provide content managers, evaluators, and owners with a high-level overview.
The charts shown are added during a customer SparkLearn implementation and can be updated if desired based on custom analytics.
Summary Dashboards include:
- Unique Users by Month
- New Users Over Past 30 Days
- Most Active Learners Over Past 30 Days
- Platform Usage Over Past 30 Days
- Popular Times Over Past 30 Days
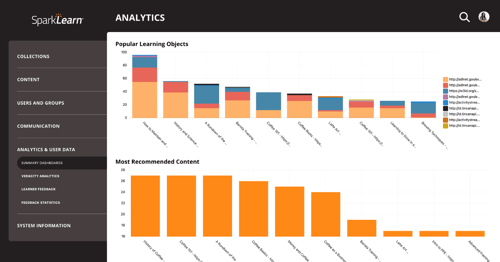
- Popular Learning Objects Over Past 30 Days
- Top Search Queries Over Past 30 Days
- Content Relevance
- Most Missed Questions Over Past 30 Days
- Most Recommended Content Over Past 30 Days
- and more!
New Analytics Dashboards (included with version 3.22)
These dashboards allow for more distinct views into the learner data and will be updated regularly.
- Article Metrics
- Course Metrics
- Efficiency Metrics
- Event Metrics
- User Metrics
Visual Guide
- Select Analytics & User Data from the menu on the left of the screen

- Under Analytics & User Data, select Summary Dashboards
- Scroll to view the dashboards (listed above)
Still can’t find what you're looking for? Contact Support